Categorical data consists of variables that can take on a limited set of values(“levels”). Common examples include gender, grades and star-ratings. Let’s discuss some of the techniques for extracting insights from it.

Photo by Xavi Cabrera on Unsplash
pandas is arguably the go-to library for data manipulation & analysis in Python. It has a dedicated CategoricalDtype, which has the following desirable properties:
-
Order & Sorting
You can explicitly specify the order of categories:
 >>> import pandas as pd
 >>> grades = pd.Series(
 ...     ["Distinction"] * 20 + ["Merit"] * 130 + ["Pass"] * 50,
 ...     # Smallest to largest:   "Pass" -> "Merit" -> "Distinction"
 ...     dtype=pd.CategoricalDtype(["Pass", "Merit", "Distinction"], ordered=True)
 ... )
Or even reorder pre-existing categorical data.
 >>> grades_reversed = grades.cat.reorder_categories(["Distinction", "Merit", "Pass"])
 >>> grades_reversed.dtype
 CategoricalDtype(categories=['Distinction', 'Merit', 'Pass'], ordered=True)
Ordered categorical data supports comparison operators, and hence sorting.
>>> grades.max() 'Distinction' >>> grades[grades < "Distinction"].unique() ['Merit', 'Pass'] Categories (3, object): ['Pass' < 'Merit' < 'Distinction'] -
Memory efficiency
Please see memory usage for more details.
 >>> grades_default_dtype = pd.Series(grades.to_list())
 >>> grades_default_dtype.dtype
 dtype('O')
 >>> grades_default_dtype.memory_usage()
 1728
 >>> grades.dtype
 CategoricalDtype(categories=['Pass', 'Merit', 'Distinction'], ordered=True)
 >>> grades.memory_usage()
 460
1. Descriptive Statistics
You can get summary statistics using the describe method:
>>> student_info = pd.DataFrame({"grade": grades, "class_room": list("ABCD")*50})
>>> student_info.describe()
        grade class_room
count     200        200
unique      3          4
top     Merit          A
freq      130         50
2. Contingency Tables
You can create contingency tables using pandas.crosstab.
>>> pd.crosstab(student_info["grade"], student_info["class_room"],
...             margins=True, margins_name="Total")
class_room    A   B   C   D  Total
grade
Pass         12  12  13  13     50
Merit        33  33  32  32    130
Distinction   5   5   5   5     20
Total        50  50  50  50    200
3. Visualizations
You can use the plot method to create matplotlib graphs.
Let’s start by customizing matplotlib’s configuration to improve the appearance of the resultant graphs:
>>> import matplotlib.pyplot as plt
>>> plt.rc("figure", autolayout=True)
>>> plt.rc("axes.spines", right=False, top=False)
>>> plt.rc("font", family="serif")
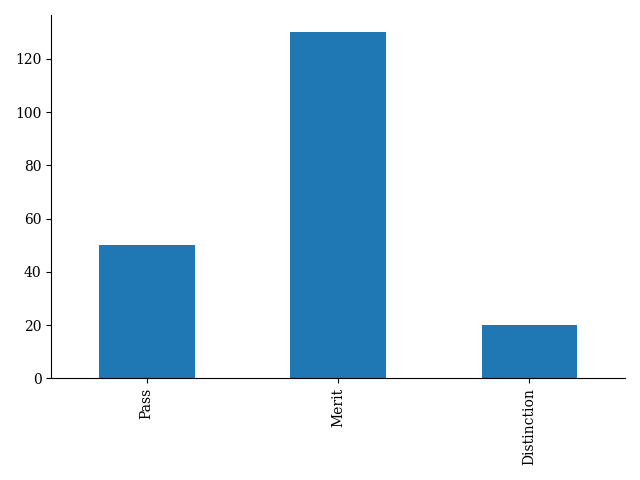
3.1 Bar-charts
>>> bar_plot = grades.value_counts(sort=False).plot(kind="bar")
>>> plt.show()
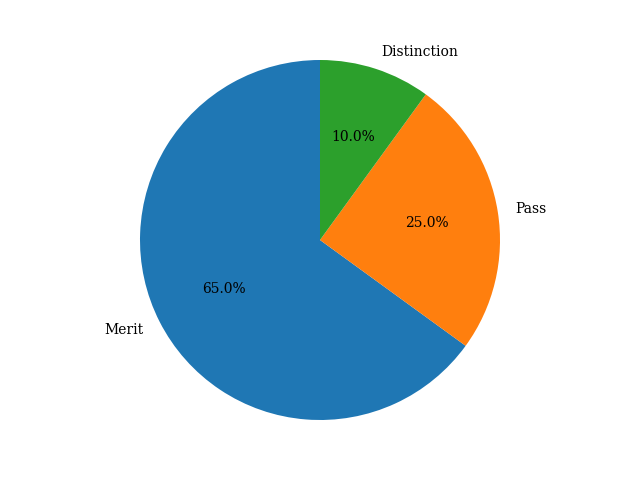
3.2 Pie-charts
>>> pie_chart = grades.value_counts().plot(kind="pie", autopct="%.1f%%", startangle=90)
>>> plt.show()
4. One-Hot Encoding
One-hot encoding is a popular technique for generating numeric features from categorical data.
You can use pandas.get_dummies to one-hot encode categorical data:
>>> oh_encoded = pd.get_dummies(student_info)
>>> oh_encoded.sample(5)
     grade_Pass  grade_Merit  grade_Distinction  class_room_A  class_room_B  class_room_C  class_room_D
7             0            0                  1             0             0             0             1
33            0            1                  0             0             1             0             0
137           0            1                  0             0             1             0             0
47            0            1                  0             0             0             0             1
147           0            1                  0             0             0             0             1
Further Reading
- Categorical data - pandas User Guide
- Visualizing categorical data with seaborn
- Introduction to Modern Statistics